
Height difference charts are useful tools for visualizing and comparing height variations between people, objects, or animals. These charts can serve a wide range of purposes, from practical applications like designing ergonomic furniture to fun comparisons, such as seeing how a favorite celebrity stacks up against a historical figure. In this article, we’ll explore various types of height difference charts, their uses, and how they can help in different fields.
What is a Height Difference Chart?
A height difference chart is a graphical representation that compares the heights of two or more entities. These charts can be simple, showing only numerical height values, or more detailed, incorporating visual representations, proportional scaling, or side-by-side comparisons.
Types of Height Difference Charts
There are several types of height difference charts, each catering to different needs and audiences. Let’s explore some of the most common ones:
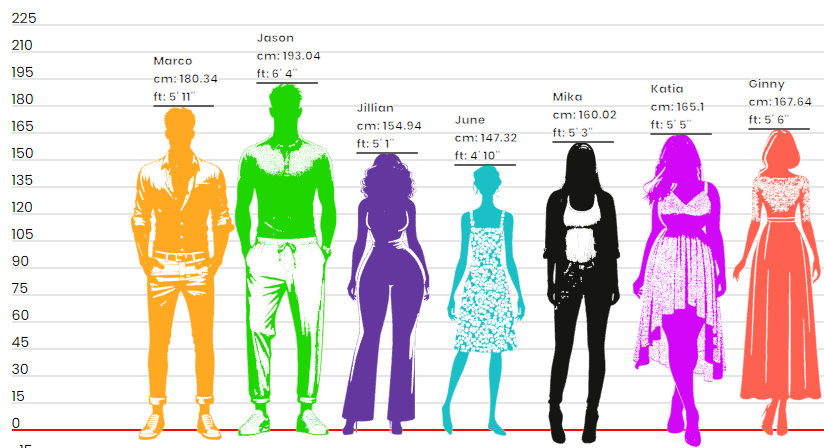
1. Human Height Comparison Charts
One of the most common types of height difference charts compares human heights. These are often used in a variety of settings:
- Educational Purposes: Schools and science textbooks use height charts to illustrate growth patterns and average heights across different age groups.
- Entertainment and Pop Culture: Many online platforms allow users to compare their height to that of celebrities, athletes, and fictional characters.
- Sports and Fitness: Athletes’ height comparisons can be useful in analyzing their performance advantages in sports like basketball, football, and gymnastics.
Example:
A height chart may show that Michael Jordan (6’6″) is significantly taller than Lionel Messi (5’7″), which can highlight why height is an advantage in basketball but less crucial in soccer.
2. Animal Height Comparison Charts
Animal height charts are fascinating because they allow people to compare the sizes of different species. These charts often feature animals standing next to an average human for scale.
- Zoo and Wildlife Education: These charts help people understand how big or small certain animals are compared to humans.
- Veterinary Science: Understanding the size differences between breeds of pets and livestock can help in medical and dietary planning.
Example:
A height chart may show that a Great Dane (around 34 inches at the shoulder) can be almost as tall as an adult human when standing on its hind legs, whereas a Dachshund (9 inches tall) remains significantly shorter.
3. Object Height Comparison Charts
These charts compare the heights of objects such as buildings, vehicles, and natural landmarks. They are particularly useful in architecture, engineering, and urban planning.
- Skyscraper Comparisons: Charts often compare the height of famous skyscrapers, such as the Burj Khalifa (2,717 feet) vs. the Empire State Building (1,454 feet).
- Vehicle and Machinery Comparisons: Comparing the height of an average car (around 5 feet) to a semi-truck (13 feet) can help in designing roads, bridges, and tunnels.
- Space Exploration: Height difference charts can illustrate how rockets like SpaceX’s Starship (394 feet) compare to historic models like the Saturn V (363 feet).
4. Historical Height Difference Charts
These charts compare the heights of historical figures, showing trends over time. People in the past were generally shorter due to differences in nutrition and healthcare.
- Evolution of Human Height: Charts may show how the average height has increased over centuries. For example, the average European male in the 17th century was about 5’5″, while today it’s around 5’9″.
- Leaders and Royalty: Height difference charts comparing famous leaders—such as Napoleon (5’6″) and Abraham Lincoln (6’4″)—help dispel myths about height perceptions.
5. Fantasy and Fictional Character Height Charts
With the rise of fantasy and sci-fi franchises, fans love comparing the heights of fictional characters. These charts are popular in online fandoms and cosplay communities.
- Movie and TV Characters: Fans may compare the heights of characters like The Hulk (8 feet) vs. Spider-Man (5’10”).
- Mythological Creatures: These charts compare the height of creatures like dragons, giants, and elves.
Example:
A height chart may show that Sauron from The Lord of the Rings (9 feet tall) would tower over an average Hobbit (3’6″).
Why Height Difference Charts Are Useful
Height difference charts serve multiple practical and educational purposes:
- Better Understanding of Scale – They provide a visual way to comprehend size differences that might be difficult to imagine.
- Design and Ergonomics – Architects, product designers, and engineers use height charts to create structures and products that accommodate different height ranges.
- Entertainment and Fun Comparisons – Fans enjoy comparing their height to favorite celebrities or fictional characters.
- Educational Purposes – They help in teaching history, biology, and physics by providing real-world comparisons.
Conclusion
Height difference charts are versatile tools that serve educational, scientific, and entertainment purposes. Whether comparing humans, animals, objects, or fictional characters, these charts help us grasp the concept of scale in an easy and engaging way. With technology allowing for customizable and interactive height charts online, the ways we compare and visualize height differences continue to evolve.
So, next time you wonder how tall you are compared to a giraffe, a skyscraper, or your favorite movie character, a height difference chart can provide the answer!